Go figure: how Britain became a nation of armchair statisticians
The British distrust of numbers goes back centuries. The Tudor authorities burned maths manuscripts in Oxford for being magical and popish. Dr John Dee, later court astrologer to Elizabeth I, was arrested in 1555 on charges of “calculating”. Florence Nightingale was thought to be a nuisance by generals for counting the soldiers who died in Crimean hospitals, to discover how better to treat them.
Now, we are a nation of armchair statisticians, obsessing over seven-day rolling averages and data transparency, and challenging bad stats whenever they appear.
The Office for Statistics Regulation (OSR) reports that complaints and queries about how government uses official figures rose to four times their previous levels in the first three months of the pandemic.
Since April, 90% of OSR cases have been about issues such as the reliability of Covid-19 testing data, and the lack of public access to data that politicians deploy.
A case in point is last week’s row about a projection of 4,000 deaths a day in December, if the virus continues unchecked.
After Sir Patrick Vallance, the government’s chief scientific adviser, presented several scenarios at the press conference announcing the second lockdown, the 4,000 deaths projection was seized on by critics. Leading the charge, Theresa May said in parliament that the figures were “chosen to support the policy”. Naturally, the former prime minister produced her own calculations to support her case.
It’s not just the OSR. More or Less, Radio 4’s weekly look behind the stats, has been heard a lot more than less. The show, presented by Tim Harford, was promoted from its comfortable yet obscure Wednesday afternoon berth to a primetime 9am slot, just before Covid-19 hit Britain.
“We had this extraordinary run over the summer, where the BBC kept extending the series – I think it was extended four times,” Harford said. His new book, How to Make the World Add Up, sold out in 36 hours when it was published in September. “So that’s another data point.”
At this point, the armchair statisticians of Britain may have noticed something missing. A story quoting statistics showing a rise in interest in statistics has not mentioned how many items of casework the OSR has dealt with. The answer: 110 from April to June 2020, compared with 109 over the previous 12 months. A huge rise – but not large numbers.
And More or Less may have moved to a slot when there are usually more listeners, but Radio Joint Audience Research, which publishes data on audience numbers, has not collected any data since March. Does that really add up to a nation obsessed with stats?
Prof Sir David Spiegelhalter, a former president of the Royal Statistical Society and the nation’s go-to man for explaining statistics, settles the matter with an anecdote. “There’s been a massive rise in public interest in statistics,” he said. “I notice that because I have had a continuous stream of correspondence.”
For those who carp that the plural of anecdote is not data, Spiegelhalter – chair of the Winton Centre for Risk and Evidence Communication at Cambridge University – pointed out that stats are not everything. Quantitative research also requires qualitative research, he said, particularly in medical contexts. “We measure things but we also do interviews that are not turned into numbers. To understand what’s going on, both are absolutely essential – it’s not a choice between the two.”
Spiegelhalter, Harford and Mary Gregory, the OSR’s deputy director of regulation, agree that we seem to be treating statistics differently today. In the frenzy of public debate before March, numbers had become ammunition to be fired at the opposing side, on Brexit, immigration, trade, crime and every other matter of contention. Now, figures about testing, deaths, cases and hospital beds are essential for having any grasp of what’s going on.
“Everybody wants to know what the latest figures are in a way that I don’t think any other statistics published by government have quite had that impact on people,” Gregory said. “I’ve never been in a job where so many people in my personal life are interested in what I do in my work life.”
Interest in the OSR soared in June when Sir David Norgrove, the head of the UK Statistics Authority, wrote to Matt Hancock, the health secretary, accusing ministers of misleading the public over testing data.
At the time, Hancock and health officials were aiming for a target of 200,000 tests a day but gave only numbers of tests supplied, rather than how many had actually been carried out – a far more useful figure for anyone trying to understand the state of the testing regime.
Since Norgrove’s broadside, the OSR has found it much easier to persuade officials and politicians to publish more data – there might be a link, Gregory said. The government’s Covid-19 dashboard has been expanded. Public Health England has published more local authority-level data. The housing ministry has published information on rough sleepers.
And as a result of criticism by the OSR of Conservative and Labour claims during last year’s general election, the Department for Education now publishes official statistics on school funding.
“Our experience is quite positive when we approach somebody because there’s been a potential misuse of statistics,” Gregory said. “We almost always get the reaction that they want to make sure they correct it.”
Politicians and journalists do not generally lie but they are not off the hook, according to Will Moy, the chief executive of the independent fact-checking charity Full Fact, which has seen about 17 million visitors to its website this year – roughly twice as many as last year.
“We’re not happy, and neither is the public,” he said. “People generally do not trust politicians or journalists to tell the truth, and that’s a tragedy. A lot of the time when we fact-check things, we find that what people have said is accurate, or they have made a reasonable mistake. The idea that everybody is lying to us all the time is wrong. But you don’t have to be lying all the time to be untrustworthy.”
Harford’s first piece of advice to amateur statisticians is to notice their own emotional reaction before disputing claims: “It’s very easy to fool yourself into rejecting things that you shouldn’t.”
Perception v reality
PERCEPTION Many people believe that violence is rising, yet fewer than two in 100 adults were victims of violent crime in 2016/7, compared with the peak of nearly five in 100 in 1995.
REALITY Violent crime is now far lower than in the 1990s.
Source: Full Fact
PERCEPTION The average guess of UK election turnout is 49%. The French believe theirs is 57%.
PERCEPTION The average guess of people in Britain is that under half the population – 44% – is overweight. In Saudi Arabia, the average guess is 28%.
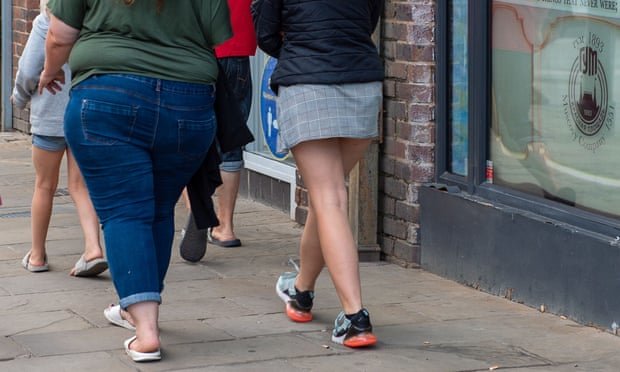
REALITY Out of every 100 people in the UK, 62 are overweight or obese. People in Saudi Arabia are even less realistic: there 71% are overweight.
Source: Bobby Duffy, The Perils of Perception
REALITY Turnout at the last UK general election was 67%, and in France it was 80%.
Source: Bobby Duffy, The Perils of Perception
PERCEPTION Many people think employment figures are inflated by zero-hours contracts.
REALITY Even if all those on zero-hours contracts are removed, 74.1% of working-age people were employed in 2019, higher than at any time
before 2015.
Source: Full Fact
PERCEPTION People in the UK guess, on average, that 25% of the population are immigrants. In the US, people guess that 33% are immigrants.
REALITY Immigrants make up 13% of the British population, and 14% of the US population.
